
The One Diagram Rule: Why Simple Visuals Win Every Meeting
Most teams use too many slides and too few diagrams. One clear visual does more in a meeting than ten bullet points. Here is why.
By Calvin Magezi
There is a moment in almost every meeting where someone says, "Let me just share my screen." They open a slide deck. Fifteen slides. Forty-seven bullet points. A table of data nobody can read from the back of the room.
The meeting derails. Everyone is skimming at different speeds. Half the room is already on their phones.
This is not a presentation problem. It is a communication design problem.
The research is clear
Studies on visual cognition have shown repeatedly that people process images 60,000 times faster than text. When you replace a description with a diagram, comprehension time collapses. When you show a flow rather than narrate it, alignment happens in seconds instead of minutes.
The mistake most teams make is treating diagrams as a finishing touch. A diagram is something you add to a presentation after the thinking is done. But the most useful diagrams are thinking tools, not decoration.
What makes a diagram win a meeting
The diagrams that work in meetings have three things in common.
They show one thing. Not the whole system. Not the entire product roadmap. One decision, one flow, one relationship. When you try to put everything in one diagram, you produce something that takes five minutes to explain. When you put one thing in a diagram, it takes five seconds to read.
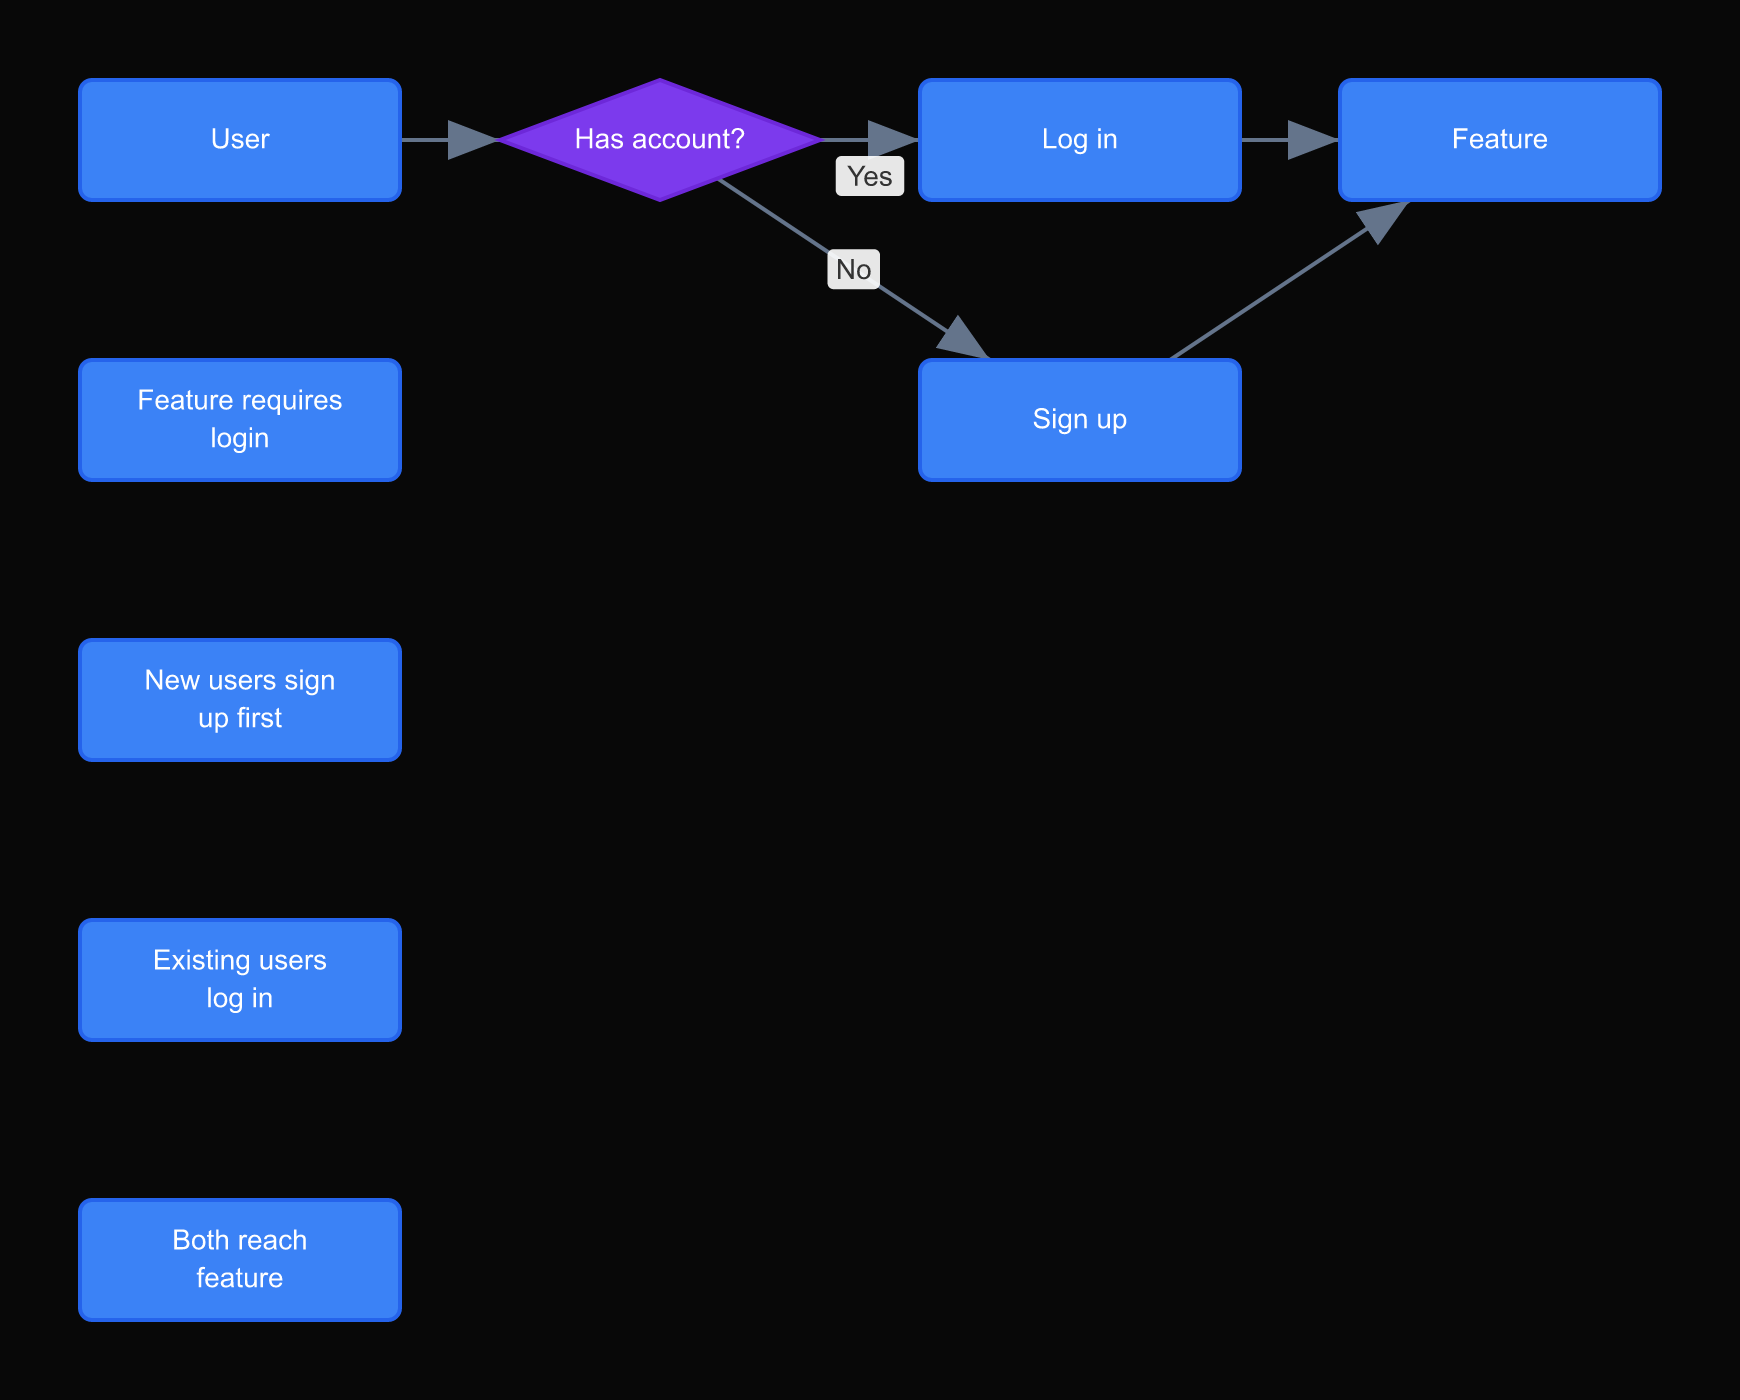
They show relationship, not description. A diagram that replaces a list of features is a bad diagram. A diagram that shows how those features connect to each other is a good one. The value is in the arrows and the structure, not the boxes.
They invite editing. The best meeting diagrams are rough. They look like something that could be wrong. This signals to the room that the diagram is a thinking tool, not a finished deliverable. People argue with finished things. People improve rough things.
The one diagram rule
Before any meeting where a decision needs to be made, ask yourself: what is the one diagram that would make this decision obvious?
Not a deck. Not a document. One diagram.
If you cannot draw that diagram, the decision is not ready to be made. The diagram forces you to clarify what you are actually proposing. The act of drawing it reveals ambiguity you did not know you had.
If you can draw it, bring only that. Print it. Paste it in Slack the day before. Show it at the start. Let the room react to it.
How DrawIt changed our process
When we built DrawIt, we started with the assumption that diagramming tools were too slow for the way people actually communicate. By the time you had opened a tool, set up a canvas, and dragged a few boxes around, the conversation had moved on.
So we built for speed. You describe what you want, and the diagram appears. You adjust in real time. You export and share in seconds.
The result is that diagrams are now the default, not the exception. When someone on the team needs to explain something, they open DrawIt. The diagram is ready before the meeting starts.
The one diagram rule works because making the diagram is no longer the hard part.
The cost of skipping the diagram
There is a measurable cost to not diagramming. It shows up in meetings that run long because participants are working from different mental models. It shows up in specs that generate twenty Slack threads of clarifying questions. It shows up in sprint reviews where the built thing does not match what the product manager imagined.
Most teams attribute these costs to communication failures, personality conflicts, or unclear ownership. In most cases, the root cause is simpler: nobody drew the picture.
A meeting that ends without alignment costs four to eight hours of follow-up work. A spec misunderstanding discovered during development costs days. A fundamental design error discovered in production costs weeks. The diagram at the start of the process costs twenty minutes.
The asymmetry is so large that the question is not whether diagrams are worth the time. The question is why teams do not make them a default. The answer, consistently, is friction. The tool is too slow, the process is too formal, or the habit has not been established.
When DrawIt removes the friction, the behavior changes. Teams that diagram rarely start diagramming regularly. Not because they decided to be better communicators, but because making the diagram is no longer a project.
Try it before your next meeting
Open DrawIt and describe the decision you need your team to make tomorrow. Not the background. Not the context. Just the decision: what are the options, what connects to what, what happens if you choose A versus B.
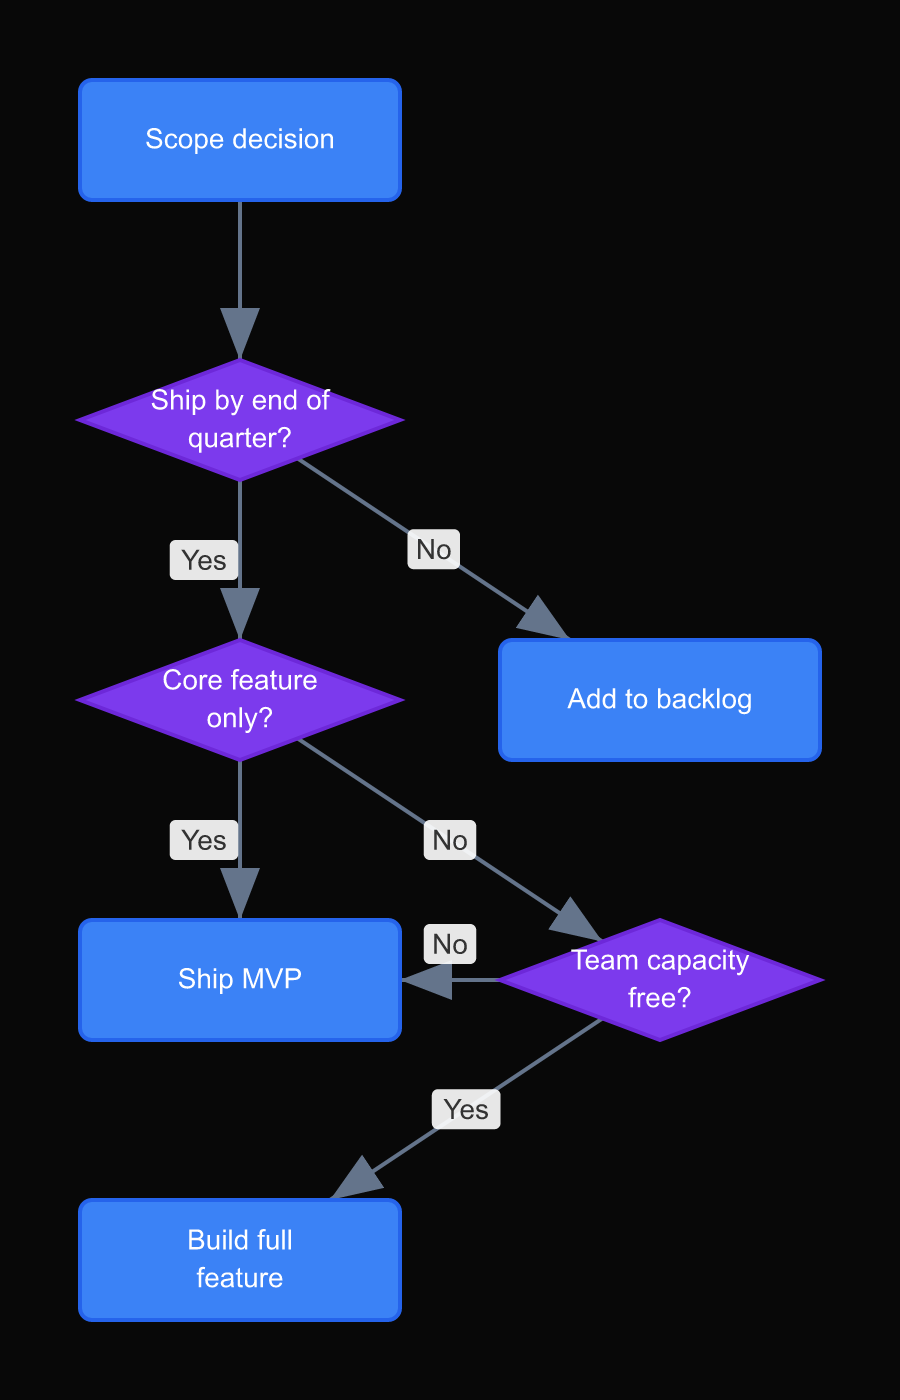
That diagram is your meeting. Everything else is overhead.